
Workforce analytics, no report-building.
Attendance trends, absence, overtime and cost per head tracked in real time. Ask for any cut and read the answer instead of assembling it.
Capabilities
What you can see
Attendance and absence trends
By month, quarter, department, location or manager, with the comparison period alongside rather than fetched separately.
Cost per head and payroll variance
What changed since last cycle and why, normalised for headcount growth so growth is not mistaken for overspend.
Overtime and utilisation
Flagged where someone is well above their own baseline, which is usually a scheduling problem worth seeing early.
Board-ready output
Ask the agent for a report or a deck and every figure links back to the record it came from.
In the product
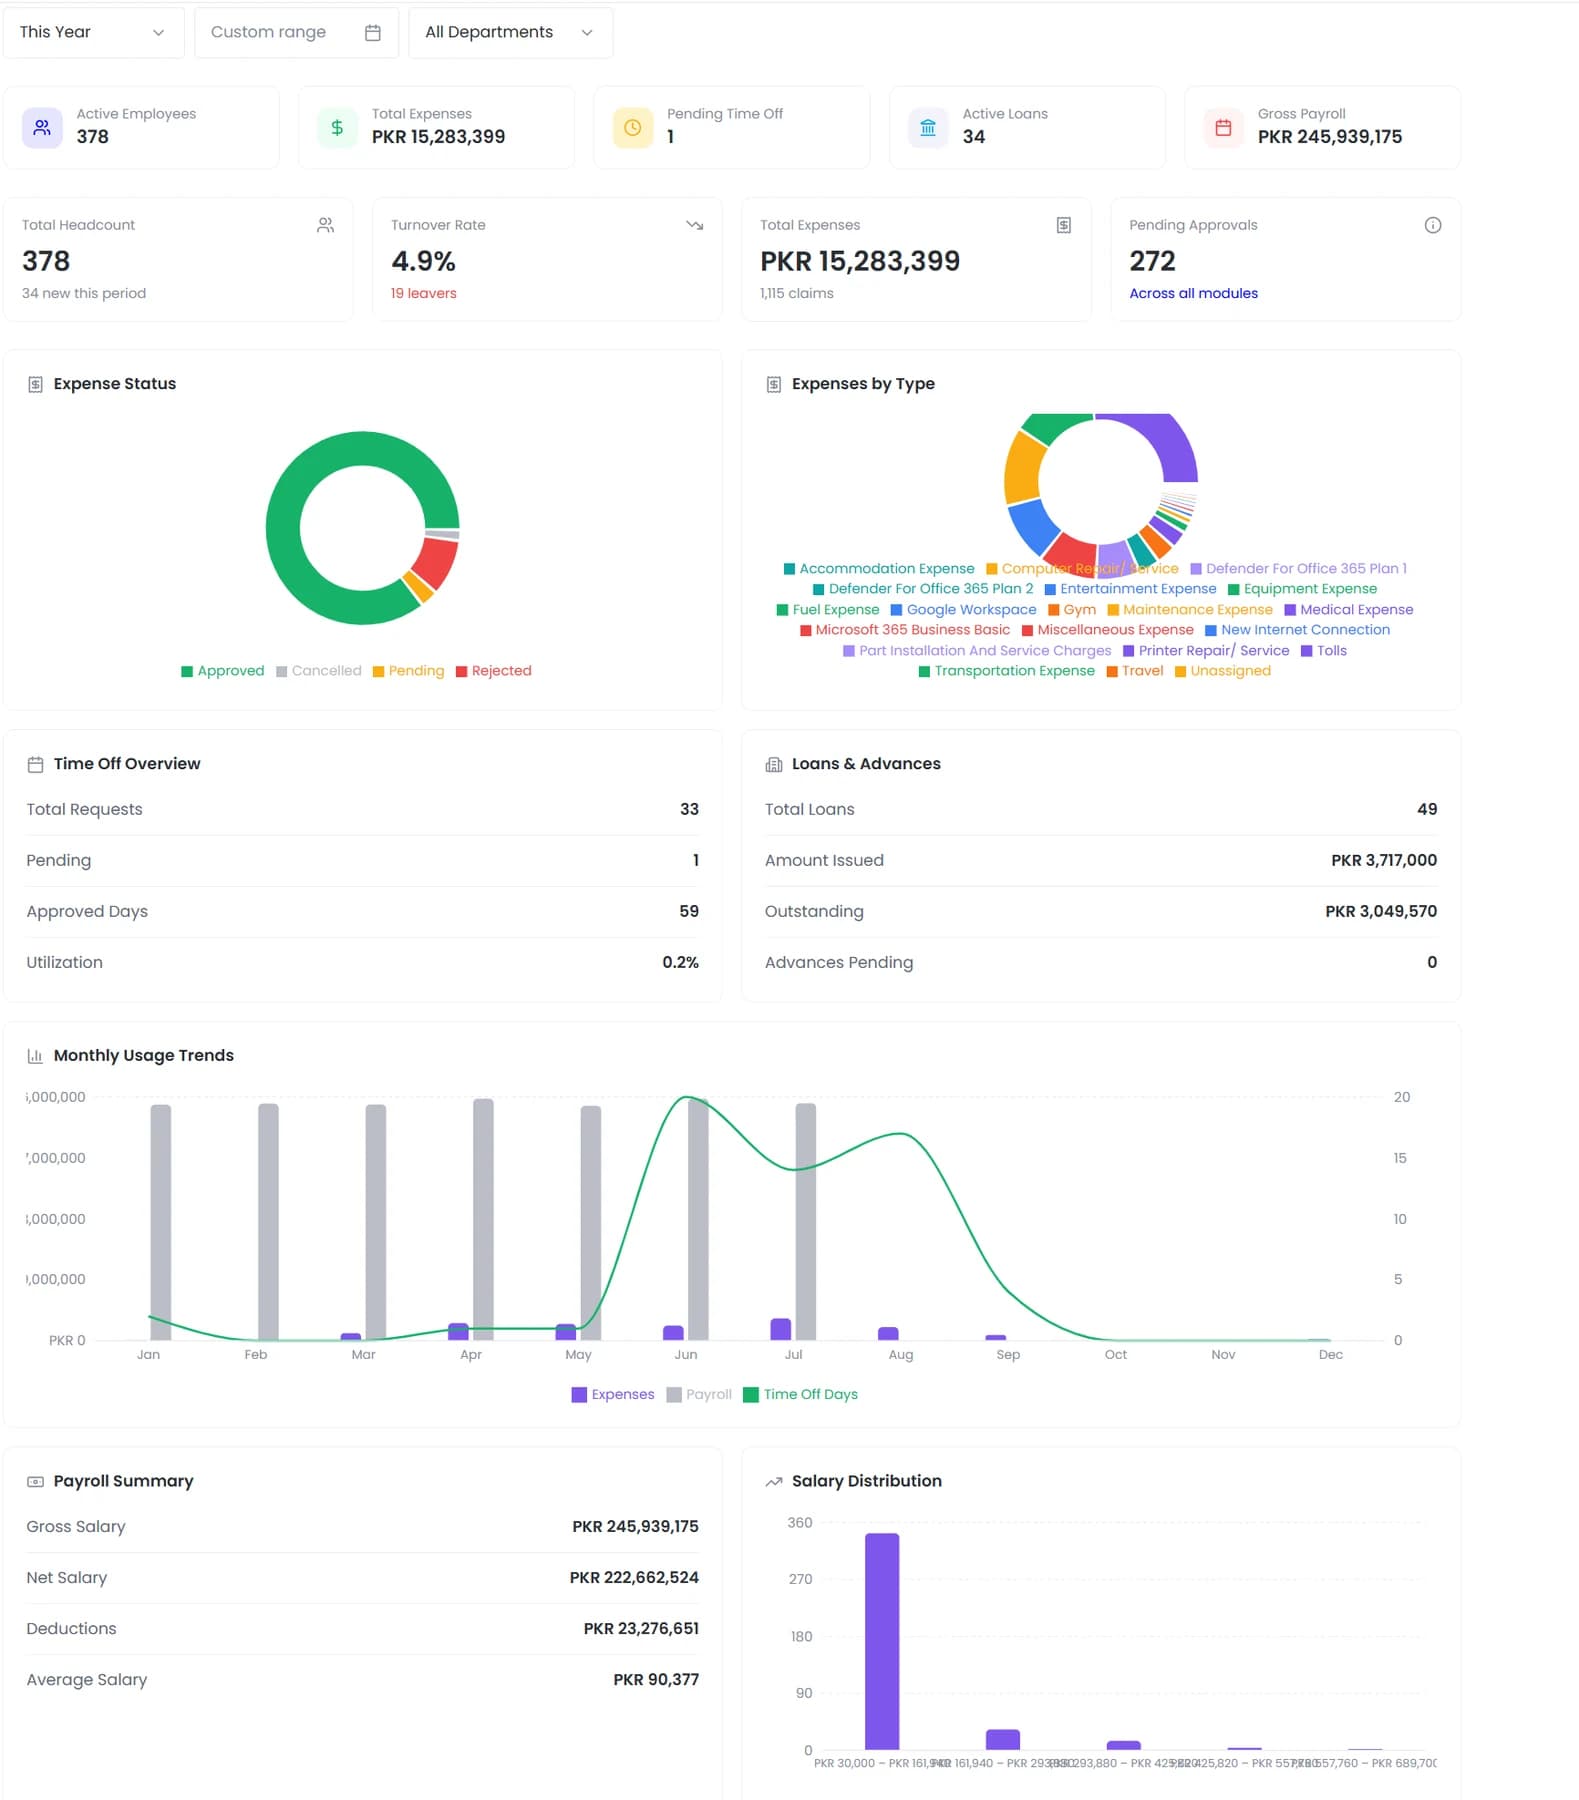
Headcount, turnover, spend and payroll on one dashboard, filtered by period and department.
Most HR reporting is not an analysis problem, it is an assembly problem. The figures exist, they just live in four systems and need a person to stitch them together before anyone can look at them.
- Attendance and absence trends
- Cost per head and payroll variance
- Overtime and utilisation
- Board-ready output
How it fits together
Reporting as a retrieval problem, not an analysis one
Most HR reporting is not hard because the analysis is difficult. It is hard because the figures live in four systems and someone has to stitch them together before anyone can look at them.
- Headcount and movement
- Cost per head
- Utilisation and overtime
Analytics
The report is the answer
When every module writes to the same record, the stitching disappears and the question can be asked directly.

By the numbers
What it looks like in practice
A number you cannot trace is a number you cannot defend in a board meeting. Every figure the agent reports can be expanded to the records behind it.
Live
Not a nightly snapshot
Any cut
Month, quarter, department, manager
Traceable
Every figure back to its record
0
Report building
In practice
Five questions and where the answer comes from
Each of these reads across modules that would otherwise need exporting and joining first.
How many people do we have
Live from the employee records, split by department, entity or location without building a report.
What did we spend against last year
Payroll and expenses read together, normalised for headcount growth so expansion is not mistaken for overspend.
Who is away next week
Approved leave and public holidays for the relevant locations, which is a scheduling question as much as an HR one.
Where is overtime building
Attendance measured against the required hours on each shift, flagged per person against their own baseline.
What does a hire cost us
Records and payroll together across the period, with the working available rather than a single figure to take on trust.
Compared
Questions and where the answer comes from
Each of these reads across modules that would otherwise need exporting first.
FAQ
Common questions
Can we schedule reports to arrive automatically?
Yes. Any view can be scheduled as a recurring extract, which is usually more useful than someone remembering to pull the same numbers before each board meeting.
Can I export the underlying data?
Yes. Any view can be exported, and the API exposes the same data programmatically for teams that maintain their own warehouse.
How current are the figures?
They read the live records rather than a nightly snapshot, so a leaver processed this morning is reflected in this afternoon's headcount.
See it running on your own data.
We will show the module working against records that look like yours, not a generic demo.